70,000 volume ed boosts efficiency through front-end flow optimization
a suburban ed achieves increased efficiency thanks to a streamlined triage process, improved front-end operations, and optimized scheduling
background
Before partnering with Core Clinical Partners, this 46-bed ED had a locally rooted, hospi- tal-employed ED staff and a strong ED medical director and nursing director. The ED had a Fast Track set up, but no provider in triage to expedite patient treatment. Patients were wait- ing nearly 35 minutes to see a provider. Like many hospitals, the ED’s budget didn’t allow for additional headcount. When Core took over ED management, we were tasked with applying our clinical, business, and operational expertise to develop a cost neutral staffing model and strategic plan to improve efficiency.
assessing opportunities for improvement
When we began work with this suburban ED, their length of stay (LOS), door-to-provider times, and LWBS rates needed improvement. When our team observed the department, it was apparent that the team had no issue handling patients who were already in beds. However, when the ED got busy, they struggled to move patients through the triage process efficiently. LOS was longer than desirable, triage of low acuity patients versus high acuity patients was not optimized, and patients were waiting too long to see a physician or advanced practice provider (APP).
implementing strategic solutions
After a 2-month assessment period, we worked closely with ED and hospital leadership to implement a few key strategic improvements: placing an advanced practice provider in triage, streamlining front-end flow, and optimizing schedules to best serve volume and acuity trends. Within 10 months of implementation, these improvements resulted in:
-
reduced low acuity los by 16%
-
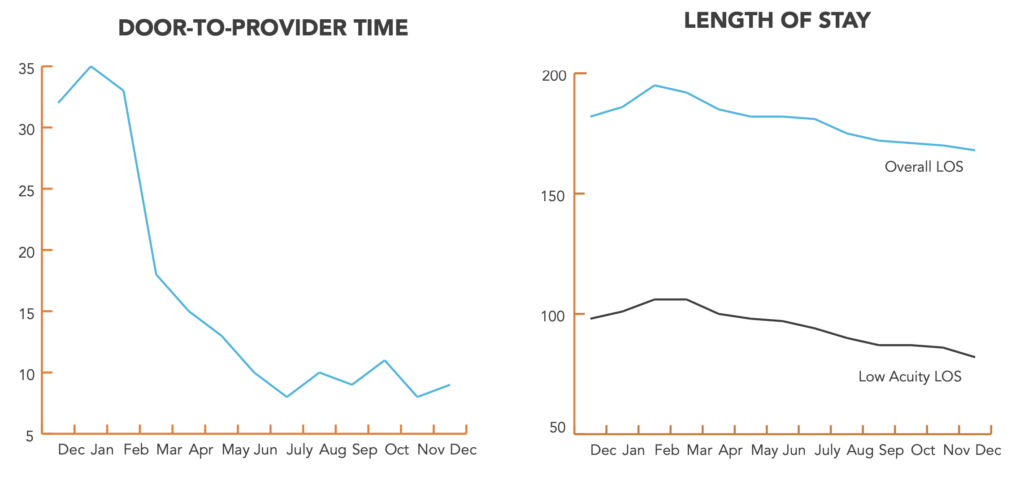
72% reduction in door-to-door provider times: 32 minutes to 9 minutes
-
85% drop in lwbs rates: 2.7% to .4%
what we did
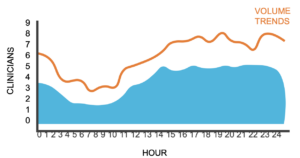
Optimized Schedule to Best Meet Volume Demands
First, we modified the ED schedule to better meet patient volume demands based on our demand capacity modeling findings. This allowed us to move 12 hrs of APP coverage to the triage area.
Streamlined Front-End Flow
We modified front-end processes by not only implementing a provider touch point earlier in the process but also creating a space for lab draws in the front-end flow. To implement these changes, we worked closely with our hospital sponsor who helped with hospital staff buy-in on the changes. Below is an example of our streamlined flow.
Implementing an APP in Triage
Placing a provider in triage immediately shortened door-to-provider time. It also enabled providers to begin work-ups sooner and discharge low acuity patients faster. As a result, more physician time was spent on higher acuity patients.
the results
Within 10 months of implementing a provider in triage, optimizing scheduling, and streamlining patient flow, the ED began to experience a significant decrease in door-to-provider times and LWBS rates. Door-to-provider times dropped from nearly 35 minutes to less than 9 minutes, a 72% decrease. Our improvements made an immediate measurable impact when we began implementation. Improved door-to-provider times directly affected other department metrics too. Concurrent with an 85% decrease in LWBS rates, the ED saw a 16% decrease in length of stay for low acuity patients—a direct result of improved patient experience and efficiency. At the same time, more efficient processes overall contributed to an 8% decrease in overall length of stay over the same time period.